Incorporating Indicators from TAlib
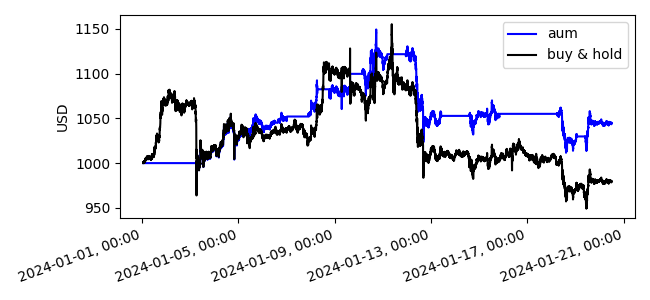
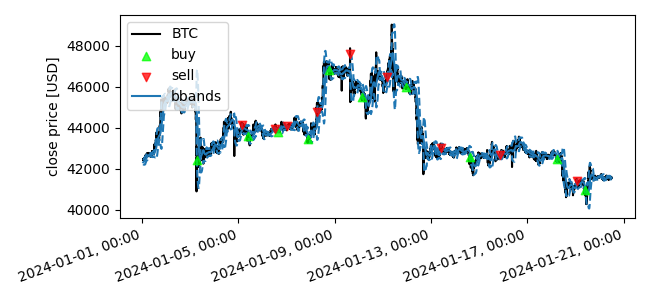
boatwright was designed to make it as easy as possible to incorporate data from 3rd party libraries. To demonstrate this, this strategy uses technical indicators from the TAlib python package, more speifically pandas_ta which outputs indicators as pandas series. Indeed, as boatwright organizes data as pandas dataframes, any 3rd party data, indicator, or custom function which can be organized as a pandas.Series (which is generally trivial to do) can be incorporated into boatwright. Here, the strategy uses Bollinger Bands (Bbands), Relative Strength Index (RSI), and stochastic oscillator (stoch) indicators, buying when all 3 indicators suggest bullish behavior, and selling when 2 of them suggest bearish.
Python source code: ../../examples/ta_lib.py
from boatwright import Strategy, Backtest
from boatwright.Data import CSVdatabase
from boatwright.Brokers import BacktestBroker
from boatwright.Orders  import MarketOrder
from boatwright.Indicators import crossover, s_max
from boatwright.Visualization import plot_backtest
from datetime import datetime
import matplotlib.pyplot as plt
import pandas_ta as ta


class TA_lib(Strategy):
    """
    An example strategy using several indicators from ta_lib
    """

    def __init__(self, period:int=7, std_devs:int=2, triggger_period:int=10, symbol:str="BTC", strategy_id="ta_lib"):
        super().__init__(symbol, strategy_id)
        self.p["period"] = period
        self.p["std_devs"] = std_devs
        self.p["triggger_period"] = triggger_period
        self.position = False

    def calculate_signals(self, df):
        help(ta.bbands) # the help features is feature of ta_lib which details the technical indicator
        bbands = ta.bbands(df["close"], length=self.p["period"], std=int(self.p["std_devs"]))
        df["lower"], df["avg"], df["upper"] = bbands.iloc[:,0], bbands.iloc[:,1], bbands.iloc[:,2]
        df["bband_buy"] = crossover(df["close"], df["lower"])
        df["bband_sell"] = crossover(df["close"], df["upper"])

        help(ta.rsi)
        df["rsi"] = ta.rsi(df["close"], length=self.p["period"])
        df["rsi_buy"] = crossover(df["close"], 30)
        df["rsi_sell"] = crossover(df["close"], 70)

        help(ta.stoch)
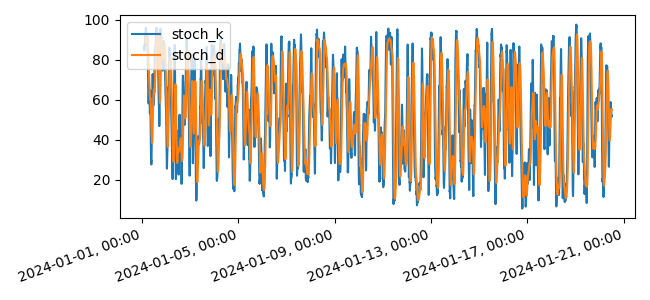
        stoch = ta.stoch(df["high"],df["low"],df["close"], k=self.p["period"], d=int(self.p["period"]/2), smooth_k=int(self.p["period"]/4))
        df["stoch_k"], df["stoch_d"] = stoch.iloc[:,0], stoch.iloc[:,1]
        df["stoch_buy"] = crossover(df["stoch_k"], df["stoch_d"])
        df["stoch_sell"] = crossover(df["stoch_d"], df["stoch_k"])

        # The maximum of each buy signal maintains the trigger as 'on' for duration of the trigger period
        # In this way, the buy/sell triggers don't have to occur at exactly the same bar, but within trigger_period bars of each other
        p = self.p["triggger_period"]
        df["buy_trigger"] = (s_max(df["bband_buy"], p) + s_max(df["rsi_buy"], p) + s_max(df["stoch_buy"], p)) >= 2
        df["sell_trigger"] = (s_max(df["bband_sell"], p) + s_max(df["rsi_sell"], p) + s_max(df["stoch_sell"], p)) > 1

        return df

    def calc_prerequisite_data_length(self):
        return self.p['period']

    def step(self, row):
        buy_trigger = row["buy_trigger"]
        sell_trigger = row["sell_trigger"]
        datetime = row["datetime"]

        if buy_trigger and not self.position:
            buy_order = MarketOrder(symbol=self.symbol, side="BUY", frac=0.95)
            self.broker.place_order(buy_order)
            self.position = True
        if sell_trigger and self.position:
            sell_order = MarketOrder(symbol=self.symbol, side="SELL", frac=1)
            self.broker.place_order(sell_order)
            self.position = False

    def plot_info(self):
        info = {
            "avg": {"ax_n": 2, "color":"C0", "linestyle":"-", "label":"bbands"},
            "lower": {"ax_n": 2, "color":"C0", "linestyle":"--", "label":None},
            "upper": {"ax_n": 2, "color":"C0", "linestyle":"--", "label":None},
            "rsi": {"ax_n": 3, "color":"black"},
            "stoch_k": {"ax_n": 4, "color":"C0"},
            "stoch_d": {"ax_n": 4, "color":"C1"},
            "buy_trigger": {"ax_n": 5, "color":"lime"},
            "sell_trigger": {"ax_n": 5, "color":"red"},
        }
        return info

# -------------------------------------------------------

# 1. define the strategy
strategy = TA_lib(period=200, std_devs=2, triggger_period=20, symbol="BTC")

# 2. load data for the backtet (including prequisite data for necessary for signal generation)
database = CSVdatabase(source="ALPACA", debug=False, dir="quickstart_data/")
start = datetime(year=2024, month=1, day=1, hour=1, minute=0)
end = datetime(year=2024, month=1, day=20, hour=12, minute=0)
data = database.load(symbol=strategy.symbol, start=start, end=end, prerequisite_data_length=strategy.calc_prerequisite_data_length(), granularity=1, granularity_unit="MINUTE", verbose=True)

# 3. declare and run the backtest
broker_model = BacktestBroker(taker_fee=0, maker_fee=0, slippage=0, quote_symbol="USD")
backtest = Backtest(strategy=strategy, data=data, broker=broker_model, debug=False)
backtest.run(verbose=True)

# 4. analyze results
plot_backtest(backtest)
plt.show()


