Strategy Example
This example shows how to write the simple Moving Average Convergence Divergence (MACD) strategy, which is used in the other examples.
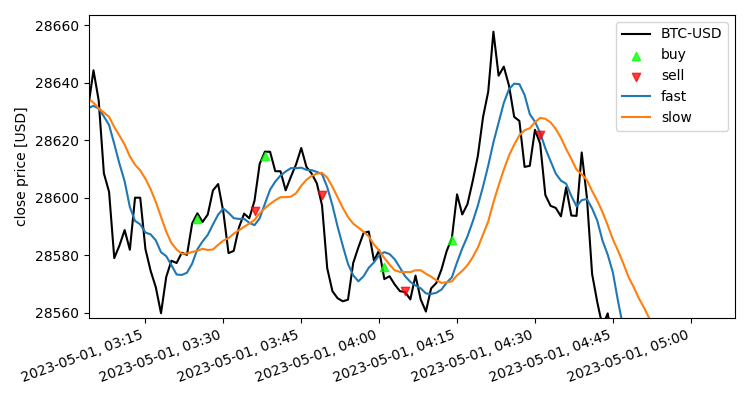
The premise is to use two moving averages of the closing price: one averaging across a shorter window of the most recent data, thus more reactive to price changes, dubbed the ‘fast’ signal; the other averaging across a larger window, the ‘slow’ signal. Bullish behavior is indicated when the fast signal crosses above the slow signal, so the strategy places a buy orders for these events, and for the bearish cross under event sell orders.
boatwright.Strategy are defined by a trading symbol e.g. “AAPL” or “BTC”, a boatwright.Broker for handling orders, and three required methods which define the trading decision logic and order managment:
calculate_signals()for computing technical indicators and other signalsstep()for completing any actions e.g. check indicators for buy/sell triggers, create and place orders with the brokercalculate_prerequisite_data_length()which communicates tobacktestandlive executionthe minimum amount of data necessary for all technical indicators in the strategy to produce values e.g. a simple moving average with period=10, needs 10 bars of data before the signal can generate.
Python source code: ../../examples/MACD.py
from boatwright import Strategy
from boatwright.Orders.Order import MarketOrder
from boatwright.Indicators import sma, crossover

class MACD(Strategy):
    """
    Moving Average Convergance Divergance (MACD) strategy
    """

    def __init__(self, fast_period:int=7, slow_period:int=14, symbol:str="BTC", strategy_id="example_MACD"):
        super().__init__(symbol, strategy_id=strategy_id)
        self.p["fast_period"] = fast_period
        self.p["slow_period"] = slow_period

    def calculate_signals(self, df):
        df["fast"] = sma(df["close"], period=self.p['fast_period'])
        df["slow"] = sma(df["close"], period=self.p['slow_period'])
        df["macd"] = df["fast"] - df["slow"]
        df["trigger"] = crossover(df["macd"], 0)
        return df

    def calc_prerequisite_data_length(self):
        return self.p['slow_period']

    def step(self, row):
        trigger = row["trigger"]

        if trigger == 1:
            buy_order = MarketOrder(symbol=self.symbol, side="BUY", frac=1)
            self.place_order(buy_order)
        elif trigger == -1:
            sell_order = MarketOrder(symbol=self.symbol, side="SELL", frac=1)
            self.place_order(sell_order)

    def plot_info(self):
        info = {
            "fast": {"ax_id": "price", "color":"C0"},
            "slow": {"ax_id": "price", "color":"C1"},
            "trigger": {"color":"magenta"},
        }
        return info