Bollinger Bands Example
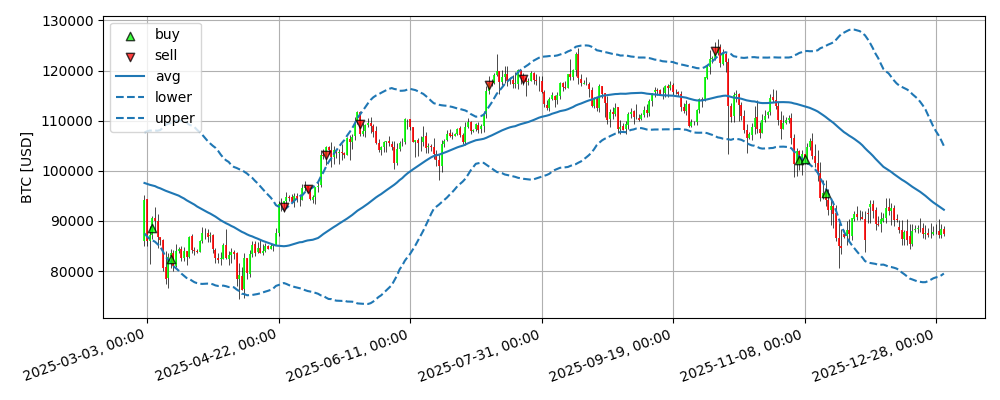
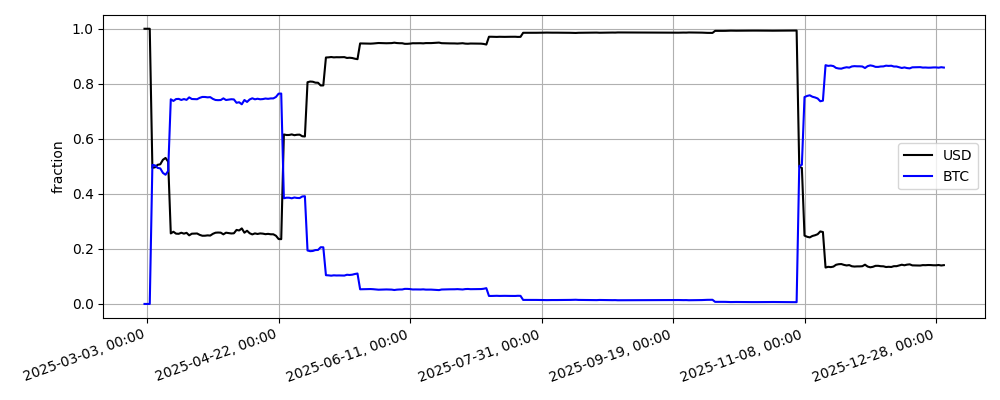
The Bollinger Bands indicator gives the standard deviation of the price movement over a given window. A common strategy is to buy when the price crosses below the lower band, and sell when the price crosses above the upper band. This strategy also uses trailing orders, which places the desired order one a certain price movement is observed. Here, the buys are only executed when the price increases 1% with respect to the minimum price (since order placement), and the sells are only executed when the price decreases 1% with respect to the maximum price (since order placement). Finally, instead of buying/selling the entire position, this strategy only buys/sells 50% of the position at a time. Committing a fraction of your position is another way to mitigate risk of and avoid being trapped by short term price swings.
Python source code: ../../examples/bollinger_bands.py
from boatwright import Strategy, Backtest
from boatwright.Data.OHLCV.CSVdatabase import CSVdatabase
from boatwright.Brokers import Broker, BacktestBroker
from boatwright.Orders import MarketOrder, TrailingOrder
from boatwright.Indicators import bollinger_bands, crossover
from boatwright.Visualization import plot_backtest
from datetime import datetime, timedelta
import matplotlib.pyplot as plt
class BollingerBands(Strategy):
"""
An example strategy using Bollinger Bands (BB) as a technical indicator and Trailing Orders
"""
def __init__(self, period:int=7, std_devs:int=2, symbol:str="BTC", strategy_id="BollingerBands"):
super().__init__(symbol, strategy_id)
self.p["period"] = period
self.p["std_devs"] = std_devs
self.position = False
def calculate_signals(self, df):
df["avg"], df["lower"], df["upper"] = bollinger_bands(df["close"], period=self.p["period"], n_std_dev=self.p["std_devs"])
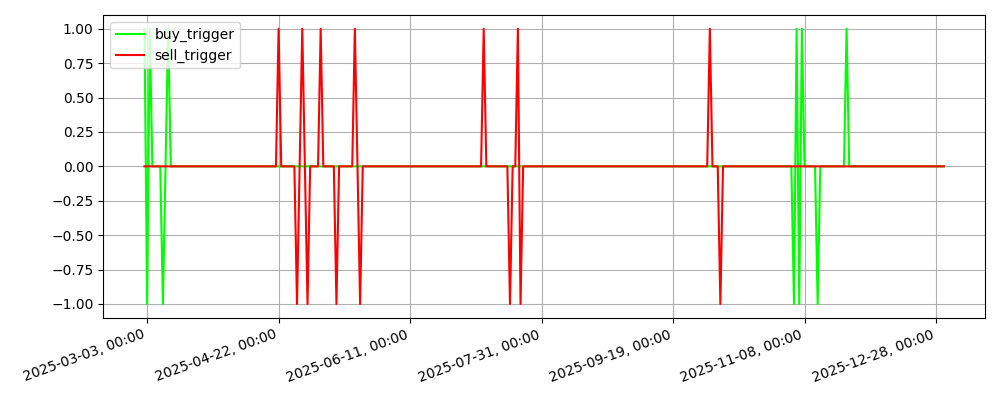
df["buy_trigger"] = crossover(df["close"], df["lower"])
df["sell_trigger"] = crossover(df["close"], df["upper"])
return df
def calc_prerequisite_data_length(self):
return self.p['period']
def step(self, row):
buy_trigger = row["buy_trigger"]
sell_trigger = row["sell_trigger"]
datetime = row["datetime"]
price = row["close"]
if buy_trigger == -1:
market_buy = MarketOrder(symbol=self.symbol, side="BUY", frac=0.5)
# This trailing orders will execute the market order when the price increases 1% with respect to the minimum price (since order placement)
# This should help avoid entering a trade if the price is continueing to swing down
buy_order = TrailingOrder(market_buy, price=price, pct_greater_than_min=1, time_in_force=datetime+timedelta(days=5))
self.place_order(buy_order)
if sell_trigger == 1:
market_sell = MarketOrder(symbol=self.symbol, side="SELL", frac=0.5)
# This trailing orders will execute the market order when the price decreases 1% with respect to the maximum price (since order placement)
# This should help avoid exiting a trade if the price is continueing to swing up
sell_order = TrailingOrder(market_sell, price=price, pct_less_than_max=-1, time_in_force=datetime+timedelta(days=5))
self.place_order(sell_order)
def plot_info(self):
info = {
"avg": {"ax_id": "price", "color":"C0", "linestyle":"-"},
"lower": {"ax_id": "price", "color":"C0", "linestyle":"--"},
"upper": {"ax_id": "price", "color":"C0", "linestyle":"--"},
"buy_trigger": {"ax_id": "triggers", "color":"lime"},
"sell_trigger": {"ax_id": "triggers", "color":"red"},
}
return info
# -------------------------------------------------------
if __name__ == "__main__":
# 1. define the strategy
strategy = BollingerBands(period=60, std_devs=2, symbol="BTC")
# 2. load data for the backtet (including prequisite data for necessary for signal generation)
database = CSVdatabase(source="ALPACA", debug=False, dir="quickstart_data/")
start = datetime(year=2025, month=1, day=1, hour=1, minute=0)
end = datetime(year=2025, month=12, day=31, hour=1, minute=0)
data = database.load(symbol=strategy.symbol, start=start, end=end, prerequisite_data_length=strategy.calc_prerequisite_data_length(), granularity=1, granularity_unit="DAY", verbose=True)
# 3. declare and run the backtest
broker_model = BacktestBroker(taker_fee=0, maker_fee=0, slippage=0, quote_symbol="USD")
backtest = Backtest(strategy=strategy, data=data, broker=broker_model, debug=False)
backtest.run(verbose=True)
# 4. analyze results
figs, axs = plot_backtest(backtest)
# saving figures for documentation
figs["aum"].savefig("../docs/examples/images/bollinger/aum.png")
figs["assets"].savefig("../docs/examples/images/bollinger/assets.png")
figs["price"].savefig("../docs/examples/images/bollinger/price.png")
figs["triggers"].savefig("../docs/examples/images/bollinger/triggers.png")
plt.show()