Backtest Example
This example executes a backtest of the Strategy Example against BTC data. For details regarding how figures were generated see the Plot Backtest routine.
Python source code: ../../examples/backtest.py
import boatwright
from MACD import MACD
from boatwright.PerformanceMetrics import ROI, PercentProfit, SharpeRatio
from boatwright.Data.OHLCV.CSVdatabase import CSVdatabase
from datetime import datetime
import matplotlib.pyplot as plt
# 1. define the backtest broker model
broker = boatwright.Brokers.BacktestBroker(starting_aum=10000, taker_fee=0.1, maker_fee=0.1, slippage=0, quote_symbol="USD")
# 2. define the strategy
strategy = MACD(fast_period=7, slow_period=14, symbol="BTC")
# 3. load data for the backtet (including prequisite data for necessary for signal generation)
database = CSVdatabase(source="ALPACA", debug=False, dir="./quickstart_data")
data = database.load(
symbol=strategy.symbol,
start=datetime(year=2025, month=2, day=1, hour=0, minute=0),
end=datetime(year=2025, month=12, day=31, hour=0, minute=0),
prerequisite_data_length=strategy.calc_prerequisite_data_length(),
granularity=1, granularity_unit="DAY",
verbose=True
)
print(data)
# 4. declare and run the backtest
backtest = boatwright.Backtest(strategy=strategy, data=data, broker=broker, debug=False)
backtest.run(verbose=True)
# 5. analyze results
print(f"ROI: {ROI().calculate(backtest)}")
print(f"Percent Profit: {PercentProfit().calculate(backtest)}")
print(f"Sharpe Ratio: {SharpeRatio().calculate(backtest, risk_free_rate=0, increments_per_year=365*24*60)}")
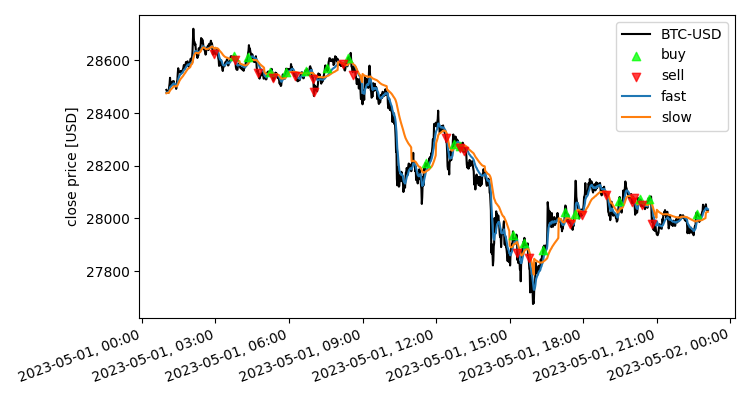
figs, axs = boatwright.Visualization.plot_backtest(backtest, candles=True)
# saving figures for documentation
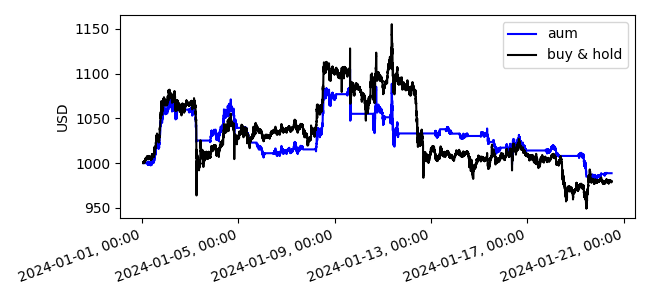
figs["aum"].savefig("../docs/examples/images/backtest/aum.png")
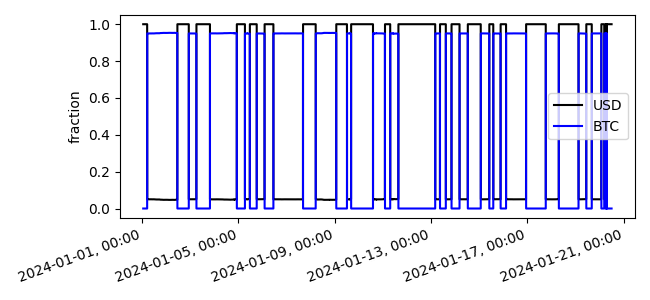
figs["assets"].savefig("../docs/examples/images/backtest/asset_fraction.png")
figs["price"].savefig("../docs/examples/images/backtest/close.png")
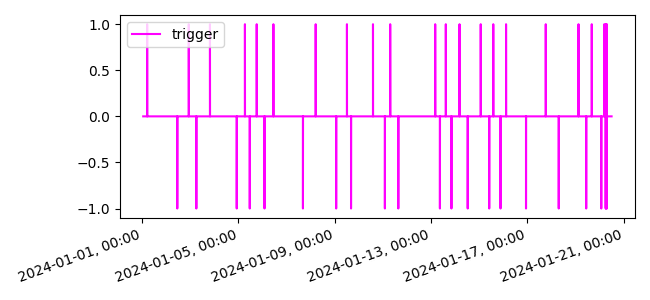
figs["trigger"].savefig("../docs/examples/images/backtest/trigger.png")
plt.show()