Parameter Scan Example
This example executes a parameter scan of the fast and slow periods in the example MACD strategy
Python source code: ../../examples/parameter_scan.py
import boatwright
from boatwright.Optimizations import generate_parameter_combinations, ParameterScan
from boatwright.PerformanceMetrics import PercentProfit
from MACD import MACD
from datetime import datetime
import matplotlib.pyplot as plt
# 1. define the strategy and broker model, load data
broker = boatwright.Brokers.BacktestBroker(taker_fee=0, maker_fee=0, slippage=0, quote_symbol="USD")
symbol="BTC"
database = boatwright.Data.OHLCV.CSVdatabase(source="ALPACA", debug=False, dir="quickstart_data/")
start = datetime(year=2025, month=1, day=1, hour=1, minute=0)
end = datetime(year=2025, month=12, day=31, hour=1, minute=0)
data = database.load(symbol=symbol, start=start, end=end, granularity=1, granularity_unit="HOUR", verbose=True)
# NOTE: for each backtest data will be trimmed off the start of this data chunk such that each backtest (which have different prerequisite data requirements) is across the same date/time range
# 2. generate a list of parameters combinations to scan
scan = {
"fast_period": [25,50,75,100,125],
"slow_period": [50,100,150,200,250]
}
parameters_sets = generate_parameter_combinations(scan)
# remove combinations where fast_period >= slow_period:
parameters_sets = [p for p in parameters_sets if (p["fast_period"] < p["slow_period"])]
# 3. declare the parameter scan, initialize data, and run
loss_function = lambda b: -PercentProfit().calculate(b) # by minimizing the negative percent profit, profit is maximized
parameter_scan = ParameterScan(strategy_class=MACD, symbol=symbol, broker=broker, loss_function=loss_function, scan=parameters_sets, data=data)
parameter_scan.make_backtests() # creates a backtest for each parameter combination
optimal_strategy = parameter_scan.run(verbose=True)
print("Optimal Parameters: ", optimal_strategy.p)
# 4. analyze results
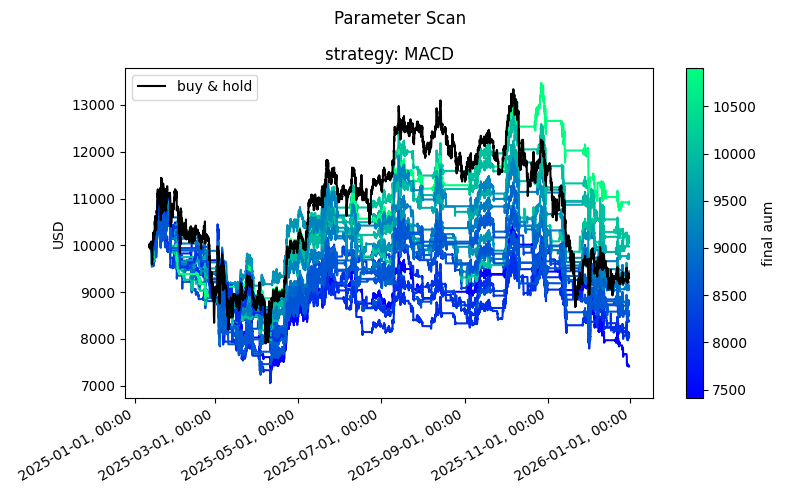
fig_aum, ax_aum = boatwright.Visualization.param_scan_stack_aum(parameter_scan)
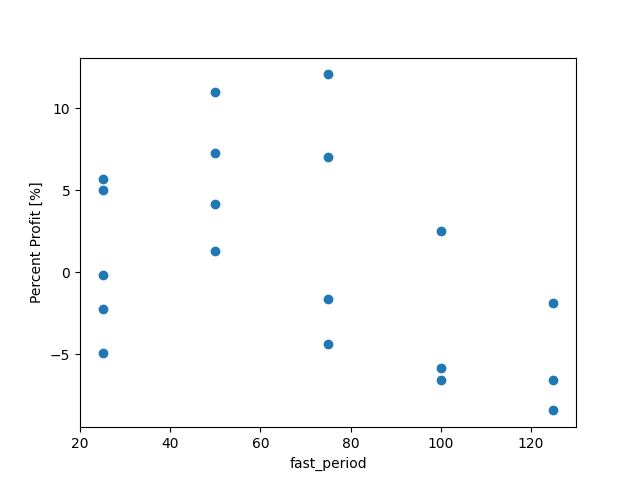
fig_fast, ax_fast = boatwright.Visualization.param_scan_1D(parameter_scan, parameter="fast_period", performance_metric=boatwright.PerformanceMetrics.PercentProfit())
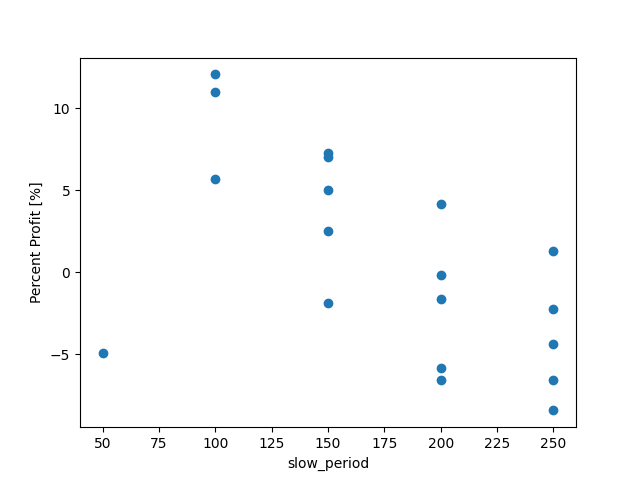
fig_slow, ax_slow = boatwright.Visualization.param_scan_1D(parameter_scan, parameter="slow_period", performance_metric=boatwright.PerformanceMetrics.PercentProfit())
# saving figures for documentation
fig_aum.savefig("../docs/examples/images/parameter_scan/aum_overlay.png")
fig_fast.savefig("../docs/examples/images/parameter_scan/fast_period.png")
fig_slow.savefig("../docs/examples/images/parameter_scan/slow_period.png")
plt.show()